Making Images Accessible
Images (includes charts, graphs, and tables) can provide a wealth of information. For students who are blind, have low vision, or use assistive technology, images can be difficult to understand or not accessible. Tips for making images accessible:
- Use images that support the information presented.
- Images should convey information and not be decorative. Avoid using images for decorative purposes.
- Make sure that images have good contrast and all objects presented in the images are easily distinguishable.
- Is all the objects in the image easily distinguishable? If not, try increasing the contrast or saturation of the image.
- Are there colors red and green or blue and yellow next to each other? If so, try finding an image that does not have these colors next to each other as students who are color blind will not be able to distinguish between objects that are either red/green or blue/yellow combination.
- Use alternative text (alt text) to add information about the image, chart or graph.
Tips for adding alt text:
- Write out information the image is conveying.
- Keep alt text concise and easy to understand.
- Add any text listed on the image in the alt text.
- Describe the meaning of the image, even if the image is rich in detail.
- To aid in writing out a description, think how to describe the image to someone on the phone.
- Use longer descriptions for complicated charts and graphs or explain these items in the body of the text.
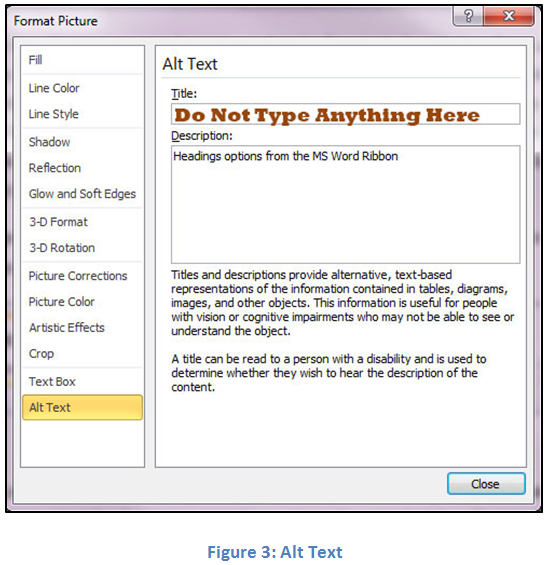
To add an alt text:
- Right-click the image, chart or graph.
- Select Format Picture (Figure 3).
- Click on Alt Text.
- Type the description in the Description box. Note: Do not add anything to the Title box.
Science Technology Engineering Math (STEM) images, charts and graphs have special challenges in adding alt text. To learn how to properly add alt text to STEM images, charts and graphs, read Guidelines for Describing STEM Images.